Financial Analysis
Comprehensive financial overview and strategic analysis of Golden Meadows Residential (2022-2024)
Prepared: November 6, 2025 | Based on IRS Schedule C Documents
Watch this detailed walkthrough of the financial analysis and business opportunity
This is YOUR opportunity. As an engaged owner-operator who can work directly in the facility, you have the ability to accept high-paying residents who require higher levels of care—residents the current management has been unable to accommodate due to health and capacity limitations.
The numbers below show what's possible when you fill all 10 beds at market rates ($4,500/month) and implement basic operational efficiencies. This isn't a fantasy—it's a realistic projection based on standard industry practices and current Nevada market conditions.
The facility is licensed, operational, and ready for YOU to transform it into a highly profitable business.
Pro Forma Results
vs. 2024 Actual Performance
| Metric | 2024 Actual | Pro Forma | Change |
|---|---|---|---|
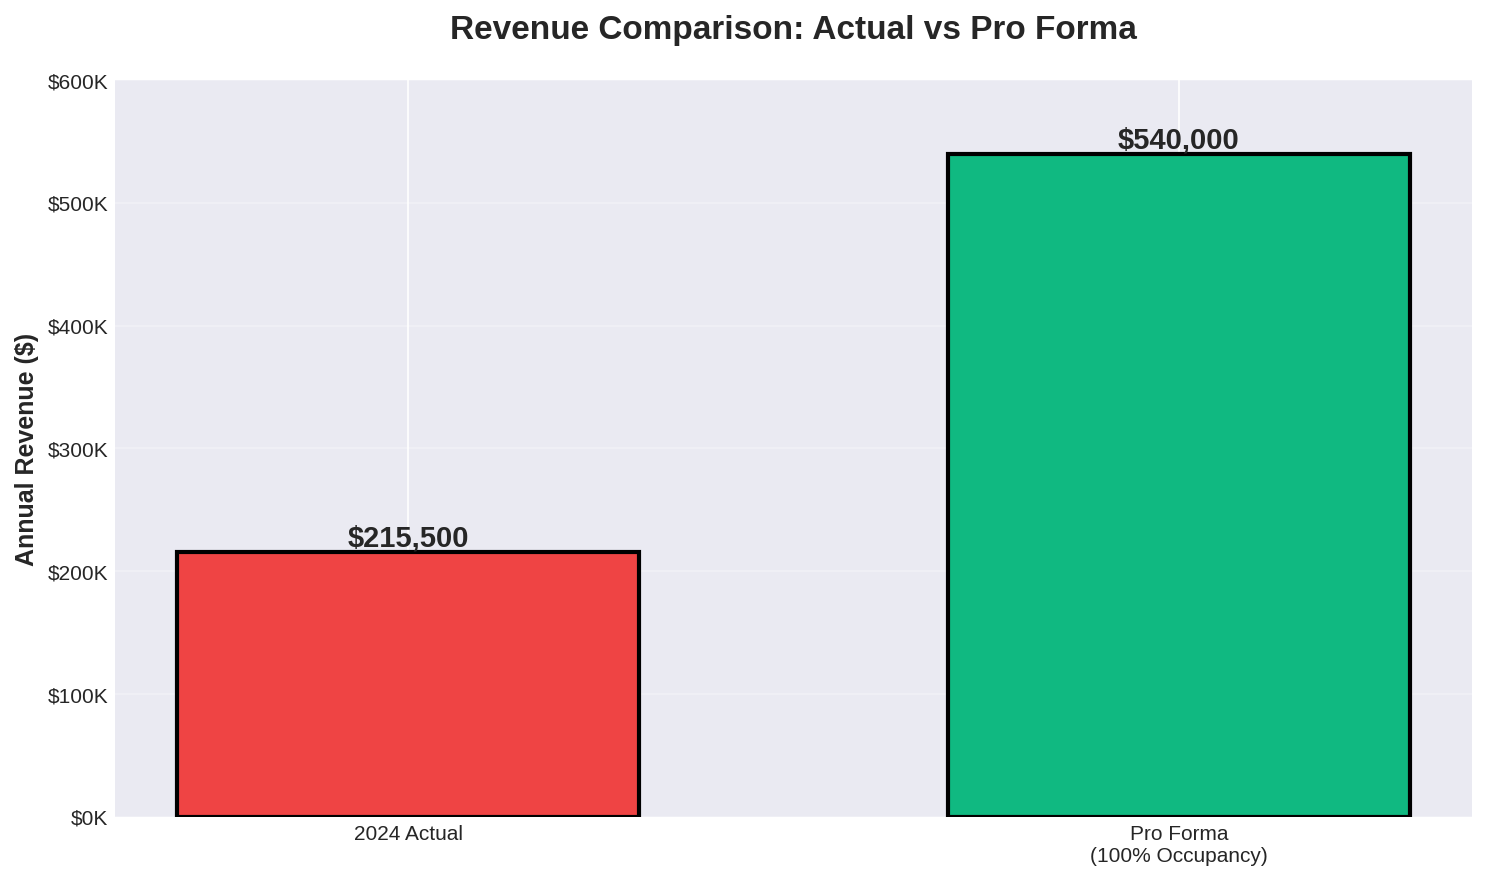
| Revenue | $215,500 | $540,000 | +150.6% |
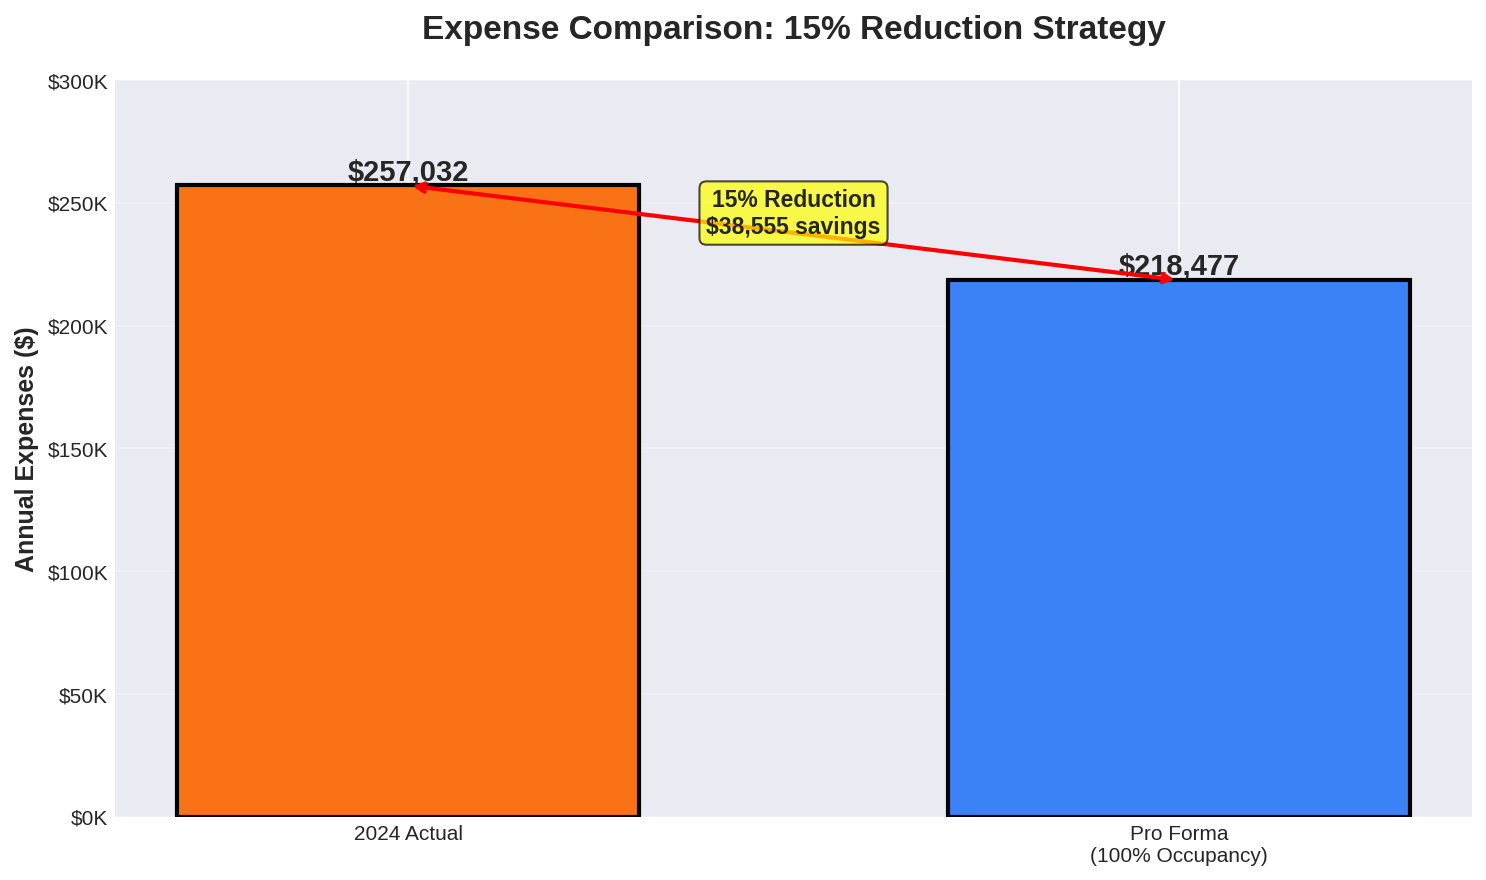
| Expenses | $257,032 | $218,477 | -15.0% |
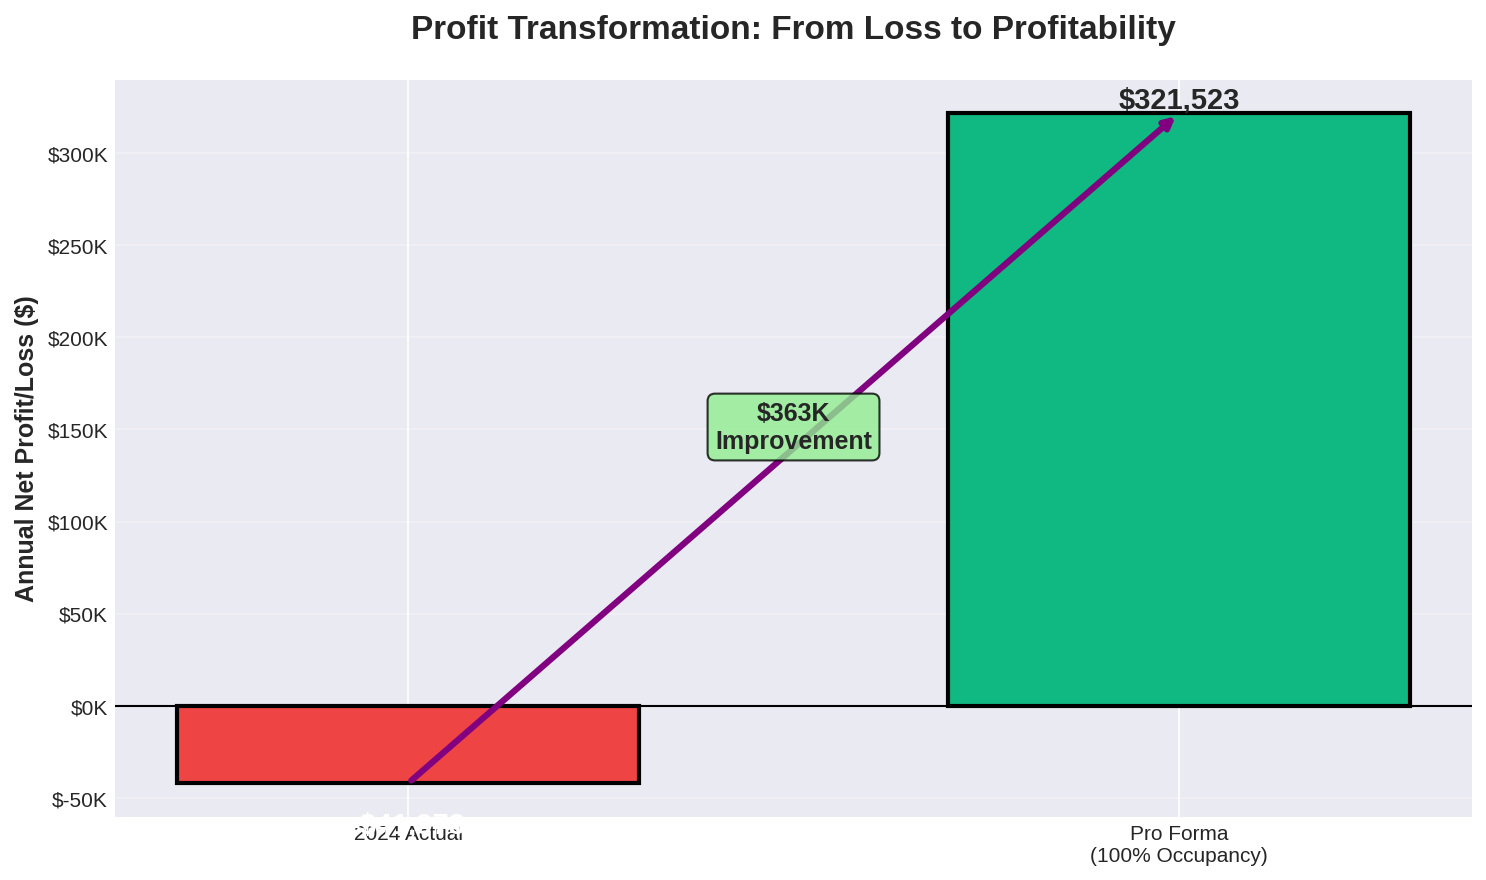
| Net Profit/Loss | ($41,973) | $321,523 | +$363,496 |
| Profit Margin | -19.5% | 59.5% | +79.0 pts |
| Expense Ratio | 119.3% | 40.5% | -78.8 pts |
| Occupancy | ~80% | 100% | +20 pts |
| Avg Rate/Bed | ~$1,796 | $4,500 | +150.6% |
Pro Forma Visual Analysis
Revenue Comparison
Expense Reduction Strategy
Profit Transformation
Occupancy Impact on Profitability
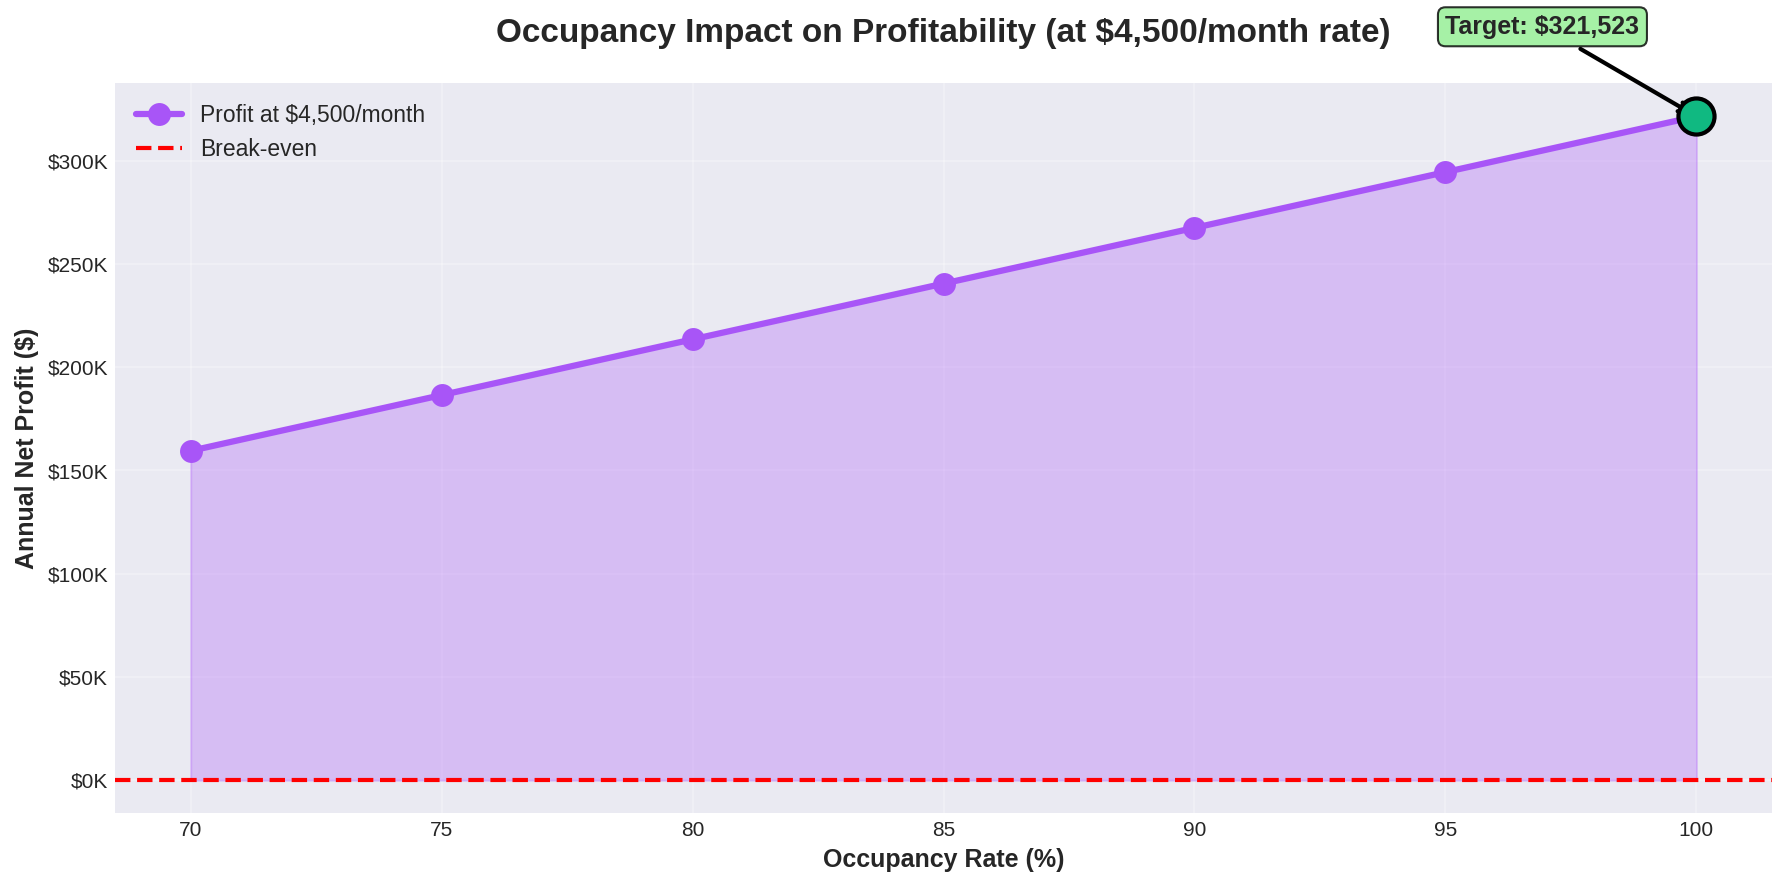
This chart demonstrates how profit scales with occupancy rate at the target $4,500/month rate. Even at 70% occupancy, the business remains profitable with $159,523 annual profit.
Monthly Cash Flow Projection
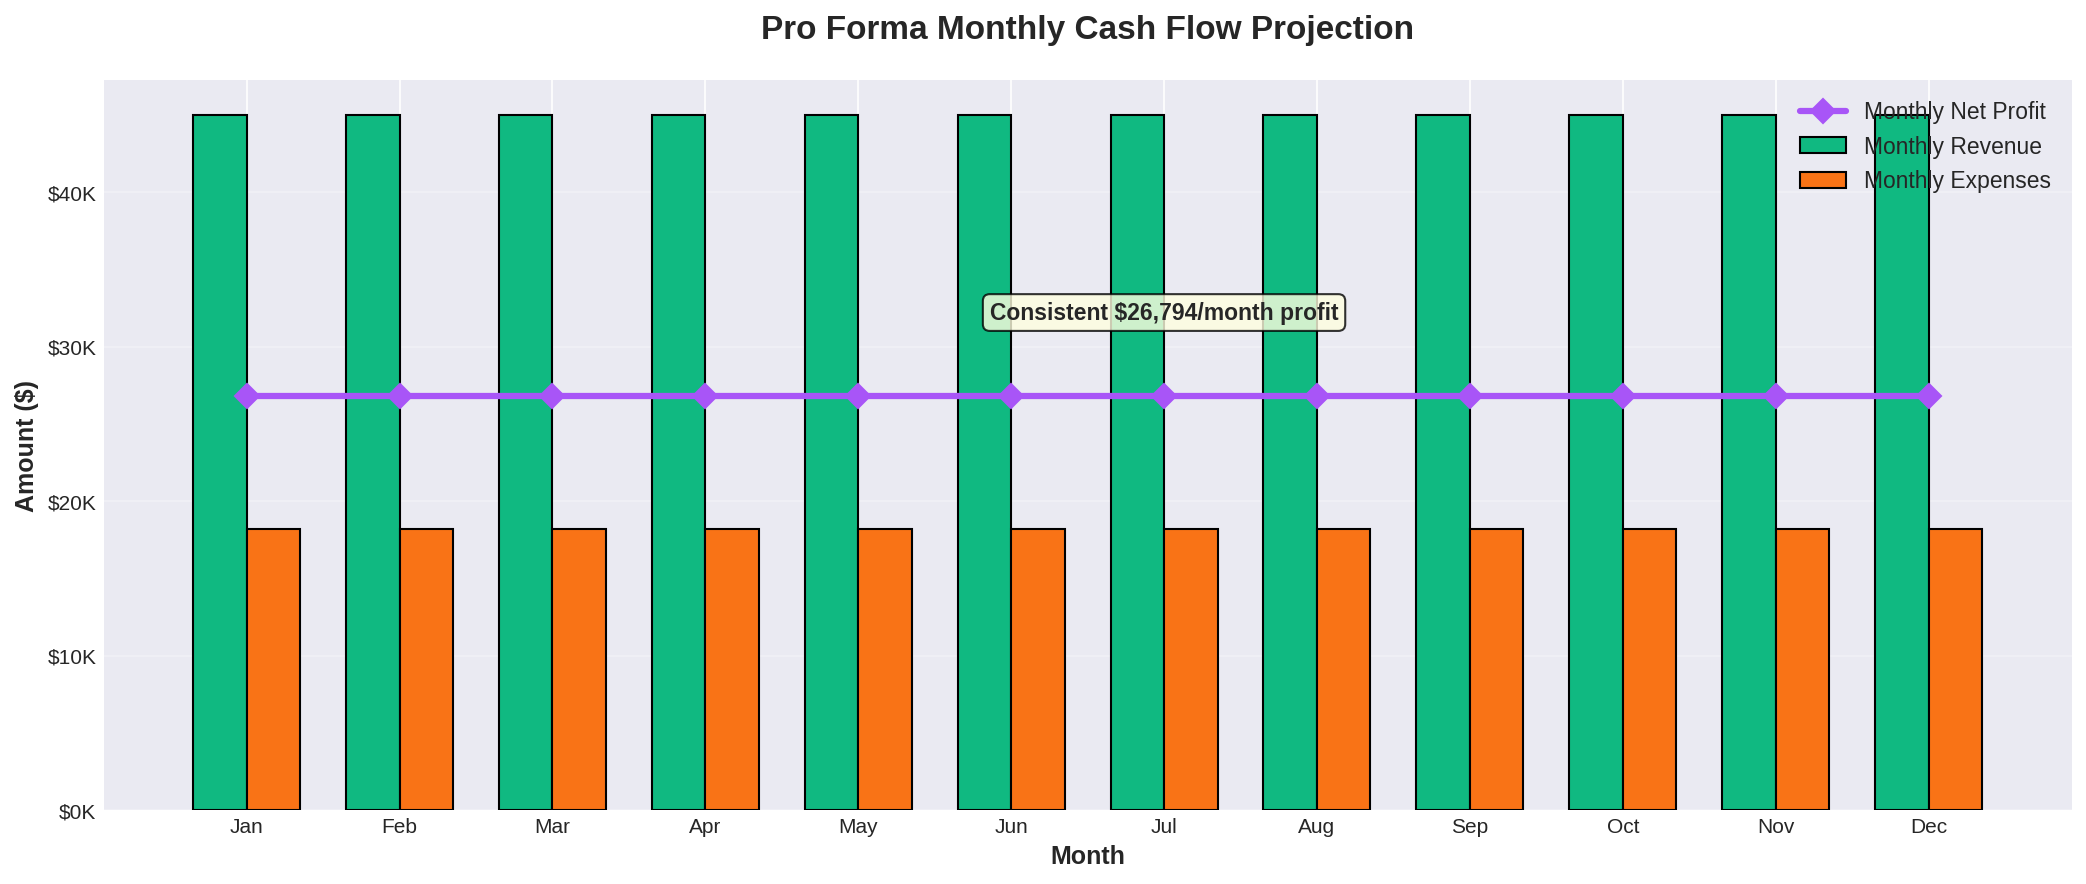
Consistent monthly profit of $26,794 provides stable cash flow for operations and growth investments.
Pathway to Pro Forma Performance
- • Maintain 100% occupancy through targeted marketing
- • Implement $4,500 mean monthly rate
- • Reduce vacancy periods to <7 days
- • Introduce premium care tier at $5,000+/month
- • Negotiate bulk supply contracts (-20% supplies)
- • Optimize staffing efficiency
- • Reduce contract labor dependency
- • Implement energy efficiency measures
- • Enhance service quality for retention
- • Build referral network with healthcare providers
- • Implement monthly financial controls
- • Monitor KPIs: occupancy, rate, expenses
Sensitivity Analysis: Profit by Occupancy & Rate
This matrix shows annual net profit across different occupancy levels and monthly rates (with 15% expense reduction from 2024 baseline).
| Monthly Rate | 70% Occupancy 7 beds occupied | 80% Occupancy 8 beds occupied | 90% Occupancy 9 beds occupied | 100% Occupancy 10 beds occupied |
|---|---|---|---|---|
| $3,500 | $75,523 25.7% margin | $117,523 35.0% margin | $159,523 42.2% margin | $201,523 48.0% margin |
| $4,000 | $117,523 35.0% margin | $165,523 43.1% margin | $213,523 49.4% margin | $261,523 54.5% margin |
| $4,500 Base Pro Forma | $159,523 42.2% margin | $213,523 49.4% margin | $267,523 55.0% margin | $321,523 59.5% margin |
| $5,000 | $201,523 48.0% margin | $261,523 54.5% margin | $321,523 59.5% margin | $381,523 63.6% margin |
| $5,500 | $243,523 52.7% margin | $309,523 58.6% margin | $375,523 63.2% margin | $441,523 66.9% margin |
Key Financial Metrics (2022-2024)
The financial trajectory of Golden Meadows Residential reveals a concerning trend. While revenue has shown some recovery in 2024 after a dip in 2023, the bottom line has worsened considerably.
Revenue Volatility
- • 2022: $239,500 (baseline year)
- • 2023: $187,500 (↓ 21.7% decline)
- • 2024: $215,500 (↑ 14.9% recovery, but still 10% below 2022)
This indicates an unstable revenue stream that requires stabilization through improved occupancy rates and service diversification.
Profitability Decline
- • 2022: +$83 profit (0.0% margin)
- • 2023: -$9,463 loss (-5.0% margin)
- • 2024: -$41,973 loss (-19.5% margin)
The growing gap highlights escalating financial distress. The business is now spending $1.19 for every $1.00 earned, an unsustainable position.
Top Expense Categories (2024)
Expense Growth Analysis
- • Supplies: +53.6% (2023→2024)
- • Contract Labor: New expense in 2024
- • Repairs & Maintenance: +39.8%
- • Wages: Stable at $70,400
- • Insurance: Slight decrease
- • Depreciation: Declining trend
1. Immediate Expense Audit & Cost Reduction
Conduct a comprehensive audit of the top three expense categories: Supplies, Commissions, and Contract Labor.
- • Negotiate bulk purchasing agreements for supplies to reduce unit costs
- • Review commission structure and consider performance-based adjustments
- • Evaluate contract labor necessity and explore in-house alternatives
- • Target: Reduce supply costs by 20% ($9,137 annual savings)
2. Revenue Stabilization & Growth Strategy
Focus on achieving and maintaining full occupancy (10 beds) while exploring premium service offerings.
- • Implement targeted marketing to maintain 100% occupancy rate
- • Introduce tiered service packages with premium care options
- • Explore partnerships with healthcare providers for referrals
- • Target: Achieve 15% annual revenue growth ($32,325 increase)
3. Formal Budgeting & Financial Controls
Implement monthly budgeting with variance tracking to prevent expense overruns.
- • Create monthly expense budgets for each category
- • Establish approval processes for expenses exceeding budget
- • Conduct monthly financial reviews with variance analysis
- • Implement expense tracking software for real-time monitoring
4. Asset ROI Evaluation
Review depreciation schedule and evaluate whether assets are generating adequate returns.
- • Conduct asset utilization audit for all depreciable equipment
- • Consider selling or replacing underutilized assets
- • Evaluate lease vs. purchase decisions for future capital needs
- • Optimize asset lifecycle to maximize value and minimize costs
5. Three-Year Profitability Roadmap
Follow the optimistic scenario projection to achieve profitability by 2027.
- • 2025: Reduce losses to -$20K through immediate cost controls
- • 2026: Achieve break-even through revenue growth initiatives
- • 2027: Generate $30K profit with sustained growth and efficiency
- • Key Metrics: 15% annual revenue growth + 5% expense control
$540,000
10 beds × $4500/mo × 12
$218,852
2024 baseline -15%
$321,148
Revenue - Expenses
59.5%
Net Profit / Revenue
Return on Investment
Cash-on-Cash Return
116.8%
Based on $275,000 purchase price
Payback Period
10.3 mo
Time to recover investment
Scenario Comparison
| Scenario | Revenue | Expenses | Net Profit | Margin |
|---|---|---|---|---|
| 2024 Actual | $215,500 | $257,473 | ($41,973) | (19.5%) |
| Pro Forma | $540,000 | $218,850 | $321,150 | 59.5% |
| Your Scenario | $540,000 | $218,852 | $321,148 | 59.5% |
Revenue Optimization
- •Maximize Occupancy: Maintain 95-100% occupancy through proactive waitlist management and rapid turnover response
- •Rate Optimization: Conduct annual market analysis and adjust rates to match or exceed $4,500/month market rate
- •Premium Services: Offer add-on services (specialized care, therapy, activities) for additional revenue streams
- •Referral Network: Build partnerships with hospitals, doctors, and senior centers for consistent resident pipeline
- •Marketing Investment: Allocate 3-5% of revenue to digital marketing, community outreach, and reputation management
Cost Reduction Strategies
- •Bulk Purchasing: Negotiate volume discounts for supplies, food, and medical equipment (target 15-20% savings)
- •Labor Optimization: Cross-train staff to reduce overtime and contract labor dependency
- •Vendor Consolidation: Reduce number of suppliers to leverage better pricing and reduce administrative overhead
- •Energy Efficiency: Implement LED lighting, programmable thermostats, and water-saving fixtures to reduce utilities
- •Waste Reduction: Monitor food waste, supply usage, and implement just-in-time inventory management
Operational Efficiency
- •Process Standardization: Document and streamline all care procedures, admission processes, and administrative tasks
- •Technology Adoption: Implement care management software to reduce paperwork and improve staff productivity
- •Staff Training: Invest in ongoing training to reduce errors, improve care quality, and increase retention
- •Quality Metrics: Track KPIs (occupancy, resident satisfaction, staff turnover) and address issues proactively
- •Preventive Maintenance: Schedule regular facility maintenance to avoid costly emergency repairs
Quality of Care Enhancements
- •Resident Satisfaction: Conduct quarterly surveys and implement feedback to improve retention and referrals
- •Family Communication: Establish regular update schedules and transparent communication channels
- •Activities Program: Develop engaging activities calendar to enhance quality of life and justify premium pricing
- •Health Outcomes: Partner with healthcare providers to demonstrate superior health outcomes and attract referrals
- •Reputation Management: Encourage positive online reviews and testimonials to build brand reputation
Occupancy Rate
Percentage of available beds currently filled by residents. Target: 95-100% for optimal profitability.
EBITDA
Earnings Before Interest, Taxes, Depreciation, and Amortization. Measures operational profitability.
Profit Margin
Net profit divided by revenue, expressed as percentage. Indicates overall business efficiency.
Expense Ratio
Total expenses divided by revenue. Values above 100% indicate losses; below 80% is healthy.
Average Daily Rate (ADR)
Average revenue per occupied bed per day. Key metric for pricing strategy.
RevPAR
Revenue Per Available Room (bed). Combines occupancy and pricing: ADR × Occupancy Rate.
Assisted Living
Residential care providing personal care services, meals, and supervision for seniors who need help with daily activities.
Residential Care Facility
Licensed group home providing 24-hour care, supervision, and assistance with activities of daily living.
Activities of Daily Living (ADL)
Basic self-care tasks: bathing, dressing, eating, toileting, transferring, and continence.
Skilled Nursing
Medical care provided by licensed nurses, typically in nursing homes. Higher level of care than assisted living.
Memory Care
Specialized care for residents with Alzheimer's or dementia, requiring secure environment and trained staff.
Licensing Requirements
State regulations governing facility operations, staffing ratios, safety standards, and care protocols.
Staffing Ratio
Number of staff members per resident. Nevada typically requires 1:6 to 1:8 ratio depending on care level.
Care Plan
Individualized document outlining resident's needs, services provided, and goals. Required by regulations.
Turnover Rate
Frequency of resident move-outs. High turnover increases costs and reduces revenue stability.
Acuity Level
Measure of resident's care needs. Higher acuity requires more staff time and resources.
Ancillary Services
Additional services beyond basic care: therapy, specialized activities, transportation, etc.
Payer Mix
Distribution of payment sources: private pay, Medicaid, Medicare, insurance. Affects revenue and margins.
Private Pay
Residents paying out-of-pocket. Typically generates higher revenue than government-funded residents.
Medicaid
Government program covering long-term care for low-income seniors. Lower reimbursement rates than private pay.
Certificate of Occupancy
Official document certifying facility meets building codes and is approved for residential care use.
Liability Insurance
Coverage protecting facility from claims related to resident injuries, negligence, or care issues.
Quality Assurance
Systematic monitoring and evaluation of care quality, safety protocols, and regulatory compliance.
Incident Report
Documentation of accidents, injuries, or unusual occurrences. Required for regulatory compliance.
Break-Even Point
Revenue level where total income equals total expenses. No profit or loss.
Cash Flow
Movement of money in and out of business. Positive cash flow essential for operations.
Working Capital
Current assets minus current liabilities. Measures short-term financial health and liquidity.
Depreciation
Accounting method spreading cost of assets over useful life. Non-cash expense reducing taxable income.
Pro Forma
Financial projection based on assumptions. Shows hypothetical performance under specific scenarios.
Sensitivity Analysis
Examination of how profit changes with variations in key variables like occupancy and pricing.
Do you have experience in healthcare, senior care, or hospitality management?
ExperienceHave you reviewed and understood Nevada's licensing requirements for residential care facilities?
RegulatoryDo you have sufficient capital to cover 6-12 months of operating expenses during ramp-up?
FinancialCan you commit to being actively involved in daily operations, especially during the first year?
CommitmentDo you understand financial statements (P&L, balance sheet, cash flow)?
FinancialHave you researched local market rates and occupancy trends for similar facilities?
Market KnowledgeAre you prepared to hire, train, and manage a team of caregivers and support staff?
ManagementDo you have a marketing plan to attract and retain residents?
MarketingAre you comfortable with the 24/7 nature of residential care operations?
CommitmentHave you identified potential referral sources (hospitals, doctors, senior centers)?
MarketingDo you understand the difference between assisted living, skilled nursing, and residential care?
Industry KnowledgeCan you handle the emotional aspects of working with elderly residents and their families?
Personal ReadinessHave you secured or identified sources for necessary insurance coverage?
RegulatoryDo you have a plan for achieving and maintaining 90%+ occupancy?
OperationalAre you prepared to implement cost controls and monitor financial performance monthly?
FinancialScoring Guide
This report provides a comprehensive financial analysis of Golden Meadows Residential for the years 2022-2024, based on provided IRS Schedule C documents. It includes an in-depth look at revenue and profitability trends, a detailed breakdown of operating expenses, and multi-scenario financial projections.
The financial losses shown in 2023-2024 are directly attributable to current management limitations, not fundamental business problems. Specifically:
- • Health and aging issues have prevented the current owner from working the hours necessary to accept high-acuity residents who require more intensive care
- • The facility has been turning away high-paying residents ($4,500-$5,500/month) who need higher care levels because current management cannot provide that level of service
- • This has resulted in lower occupancy rates and significantly reduced revenue per bed
✅ The good news: This situation can be easily turned around by a healthy, engaged owner-operator who can accept these higher-paying residents and work directly in the facility.
Golden Meadows Residential faces significant financial challenges that require immediate and decisive action. The current trajectory is unsustainable, with operating expenses exceeding revenue by nearly 20%. However, the business has strong fundamentals including a licensed facility, established operations, and a stable revenue base that can be grown.
By implementing the recommended cost controls, focusing on revenue growth, and establishing rigorous financial management practices, the business can return to profitability within 2-3 years. The optimistic scenario projections demonstrate that a $30,000 annual profit is achievable by 2027 with disciplined execution of the strategic roadmap.
Success will require commitment to the turnaround plan, monthly monitoring of financial metrics, and willingness to make difficult decisions regarding cost structure and operational efficiency. The opportunity exists to transform this business into a profitable, sustainable enterprise.
Review the complete IRS Schedule C tax returns for Golden Meadows Residential covering fiscal years 2022, 2023, and 2024. These documents provide comprehensive financial details including revenue, expenses, depreciation, and net profit/loss. All sensitive personal information (SSN) has been redacted for security.
Registration required • All SSN information redacted • PDF format